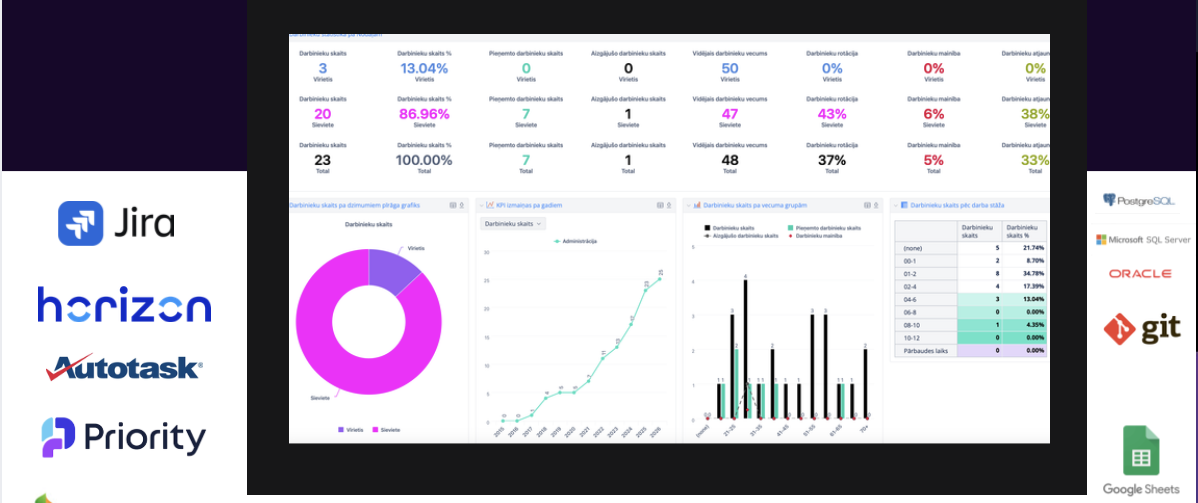
Employees are one of a company’s most important resources. However, to understand whether this resource is being used efficiently and fairly, gut feeling alone is not enough – data is needed.
How is the number of employees changing? Which teams have the highest turnover? How does pay differ between positions, organisational units and genders? Is salary growth linked to experience, responsibility and results? HR analytics is no longer just an advantage of large companies – it is becoming a practical management tool that helps make decisions about employees, pay and company costs.
Where to start with HR data records? What data is needed?
The first step is to understand which questions about its employees the company wants to answer and what data is needed to obtain those answers. To build meaningful HR analytics, you need data on the number of employee contracts, their distribution by position and department, start date, leaving date, employee gender, age, education, position code, etc. There must also be records of pay and position changes on exact dates, as well as of bonuses. It is essential to verify data availability and fill in missing data fields. Using business analytics tools, you can clean and format data and suggest systematically correct solutions for data recording that are suitable for further analysis. Once this step is done, you can obtain basic employee reports.
View the flex.bi sample library for HR data analytics
Tip: Organising employee contract and time-tracking data will also be useful in the context of financial analytics – to calculate project and product profitability by allocating employee costs, as well as to calculate employee and department efficiency and utilisation.
What to do if the data is in several systems?
This is a very common situation for a large share of companies: personnel data may be in one system, salaries in another, working-time records in yet another, while a manager’s Excel file may hold information about the budget and planned salary increases. As a result, one simple question, for example:
“How much do the employees of a specific department cost us, and how have these costs changed over the last 12 months?” may require manually combining several files and systems.
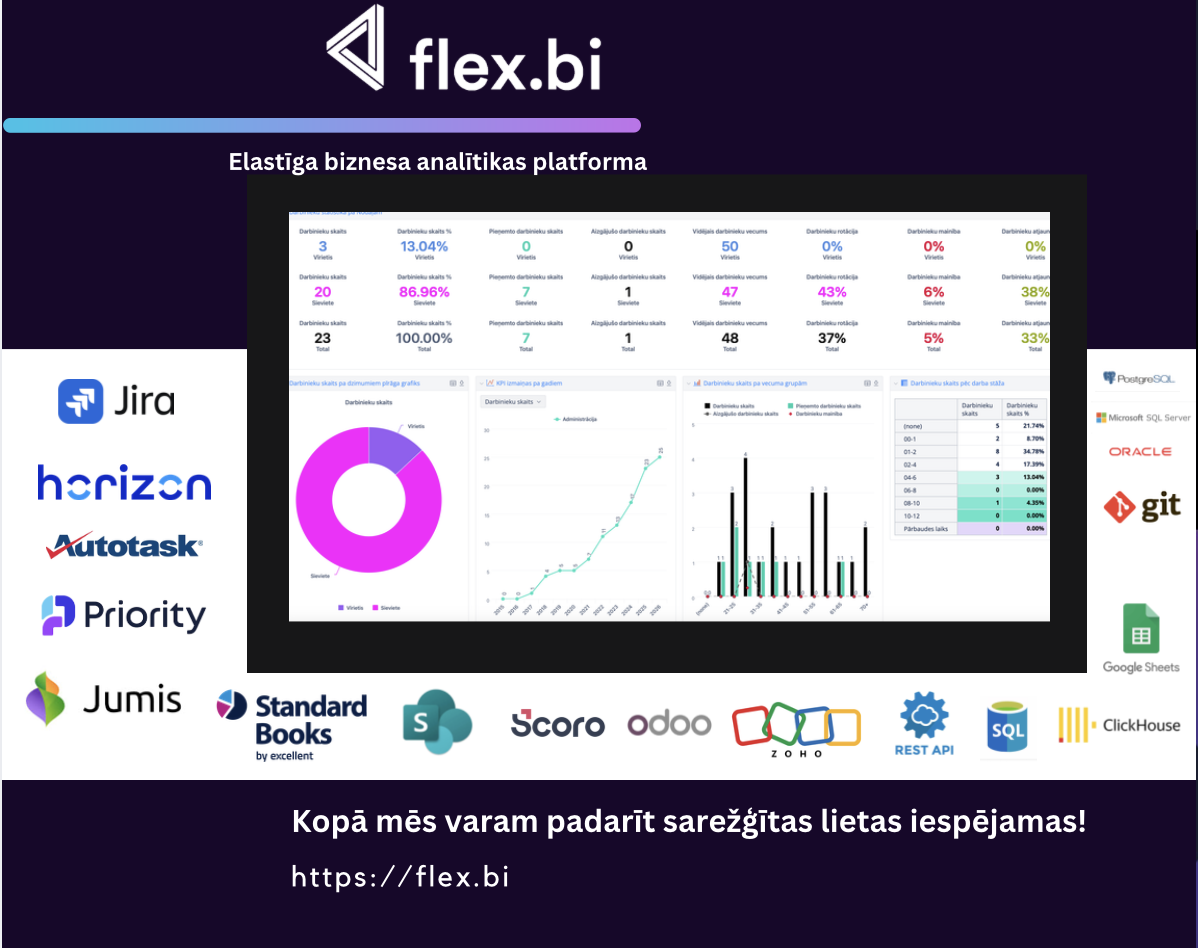
This is exactly where the advantage of BI, or business analytics, becomes apparent. The flex.bi business analytics platform supports a range of such data sources and allows them to be analysed in a unified environment, as well as automating the calculation of results in such a fairly complicated situation. Data can be connected from various sources – for example: Horizon + Scoro + XLS files + Autotask, Jumis + Jira + Microsoft SharePoint + XLS. Today there are very few technical limitations on processing data from various ERP and HR systems, SQL databases, Google Sheets, XLS/CSV files and REST APIs. flex.bi also offers building dynamic connectors with the help of AI.
What does the new EU Pay Transparency Directive require from companies?
It is a misconception that HR analytics is relevant only to companies with hundreds or thousands of employees. Under the new EU Directive 2023/970, which is binding in Latvia from 7 June 2026, an employee of a company of any size can request from their employer calculations of whether their pay and bonuses correspond to their position, as well as of the pay gap relative to a representative of the other gender in the same job category. This means that measures such as the median pay, the percentage receiving bonuses, quartile calculations, and the average pay and bonus amounts must be completely clear. In addition, every company must be able to justify the “unexplained and explained” part of differences in bonuses. Moreover, the company should categorise its positions according to 4 criteria itself, in good time.
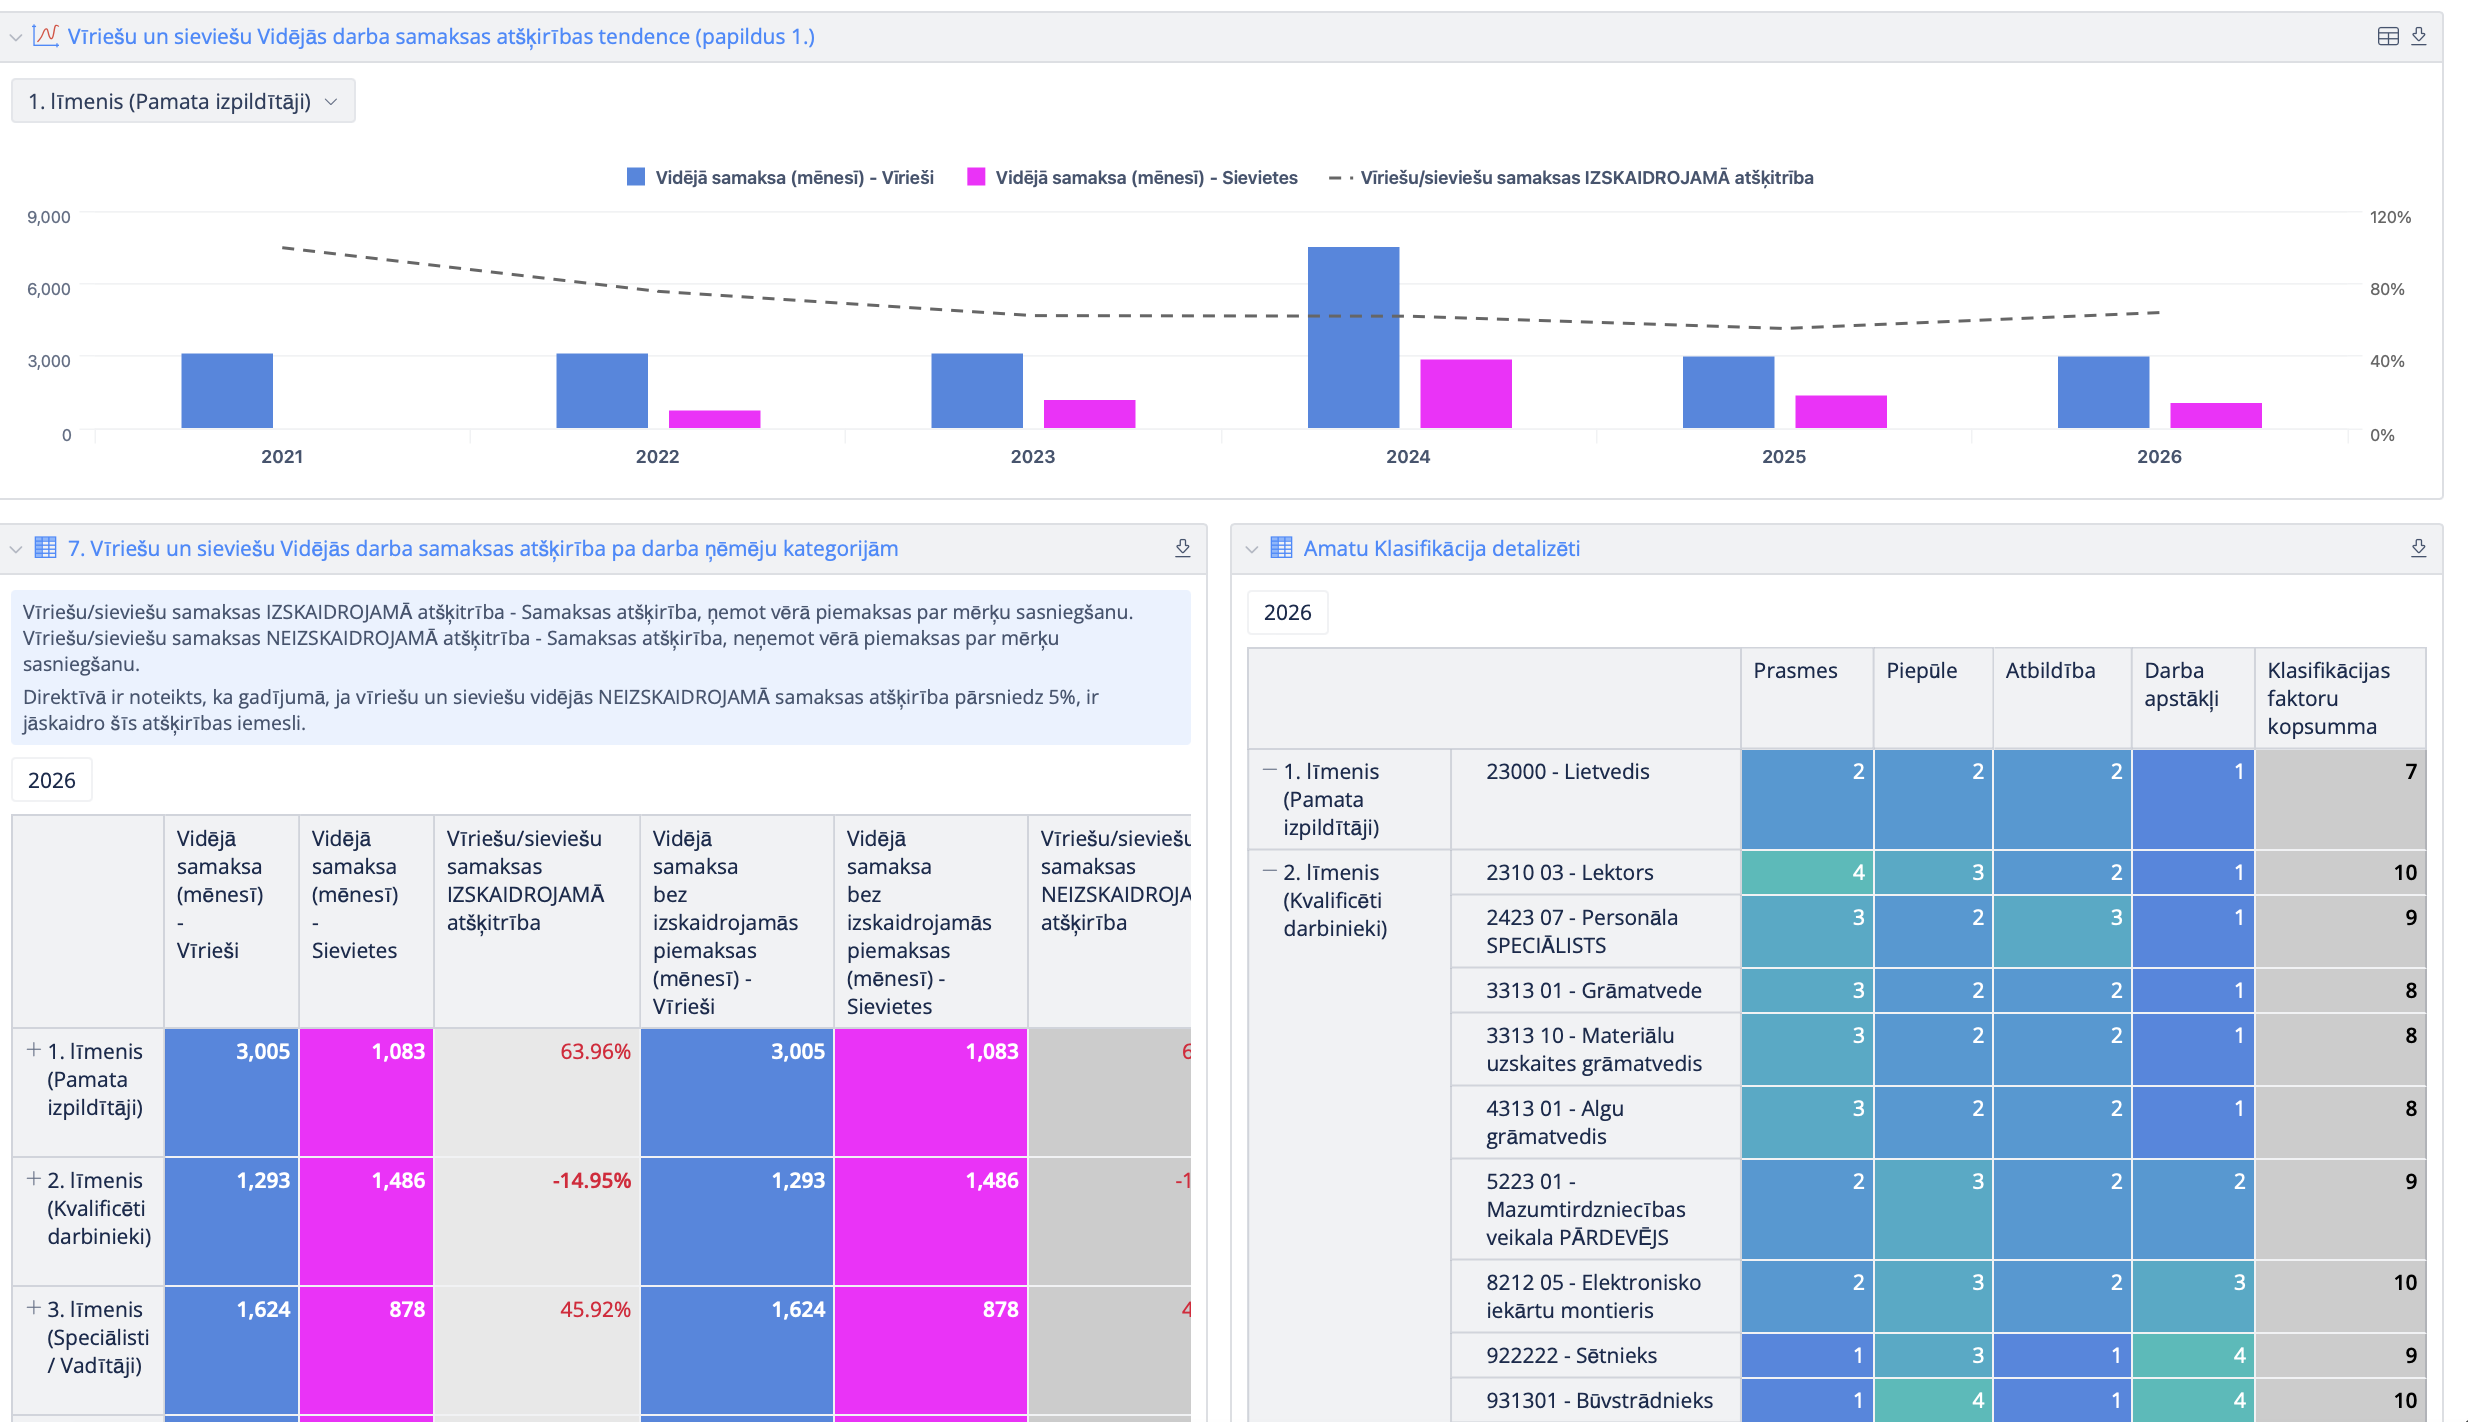
Performing such calculations and analysing the results in the form of reports, reporting on “unexplained” pay gaps exceeding 5%, is mandatory for companies with 100+ employees from 7 June 2027; however, every other company must also perform these calculations and be ready to prepare such a report on request.
View the flex.bi sample library for the Directive checkpoints
Important: Since an updated version of the calculation rules is planned for October 2027, follow the official information on the website of the Ministry of Welfare to find out the latest information.
Why is XLS not the solution? XLS is an excellent tool for small calculations, one-off analysis and data checks, but it is not suited to regularly consolidating complex data from multiple sources. It takes a lot of time, does not rule out human errors in calculations, and moreover, the results are not available online so that you can act and prevent undesirable situations.
Modern analytics solutions make it possible to combine data from different sources in a single environment and build automatically refreshed reports. Such a systematic approach lets you go from “we have a lot of HR data” to “we know what this data means”. The better we know our employee data, the better decisions we can make about the people who make up our company, and together achieve better results.
If you would like to learn more about implementing automated reports in one of your business processes, ask our specialist your question by writing to sales@flex.bi, or Book a meeting.