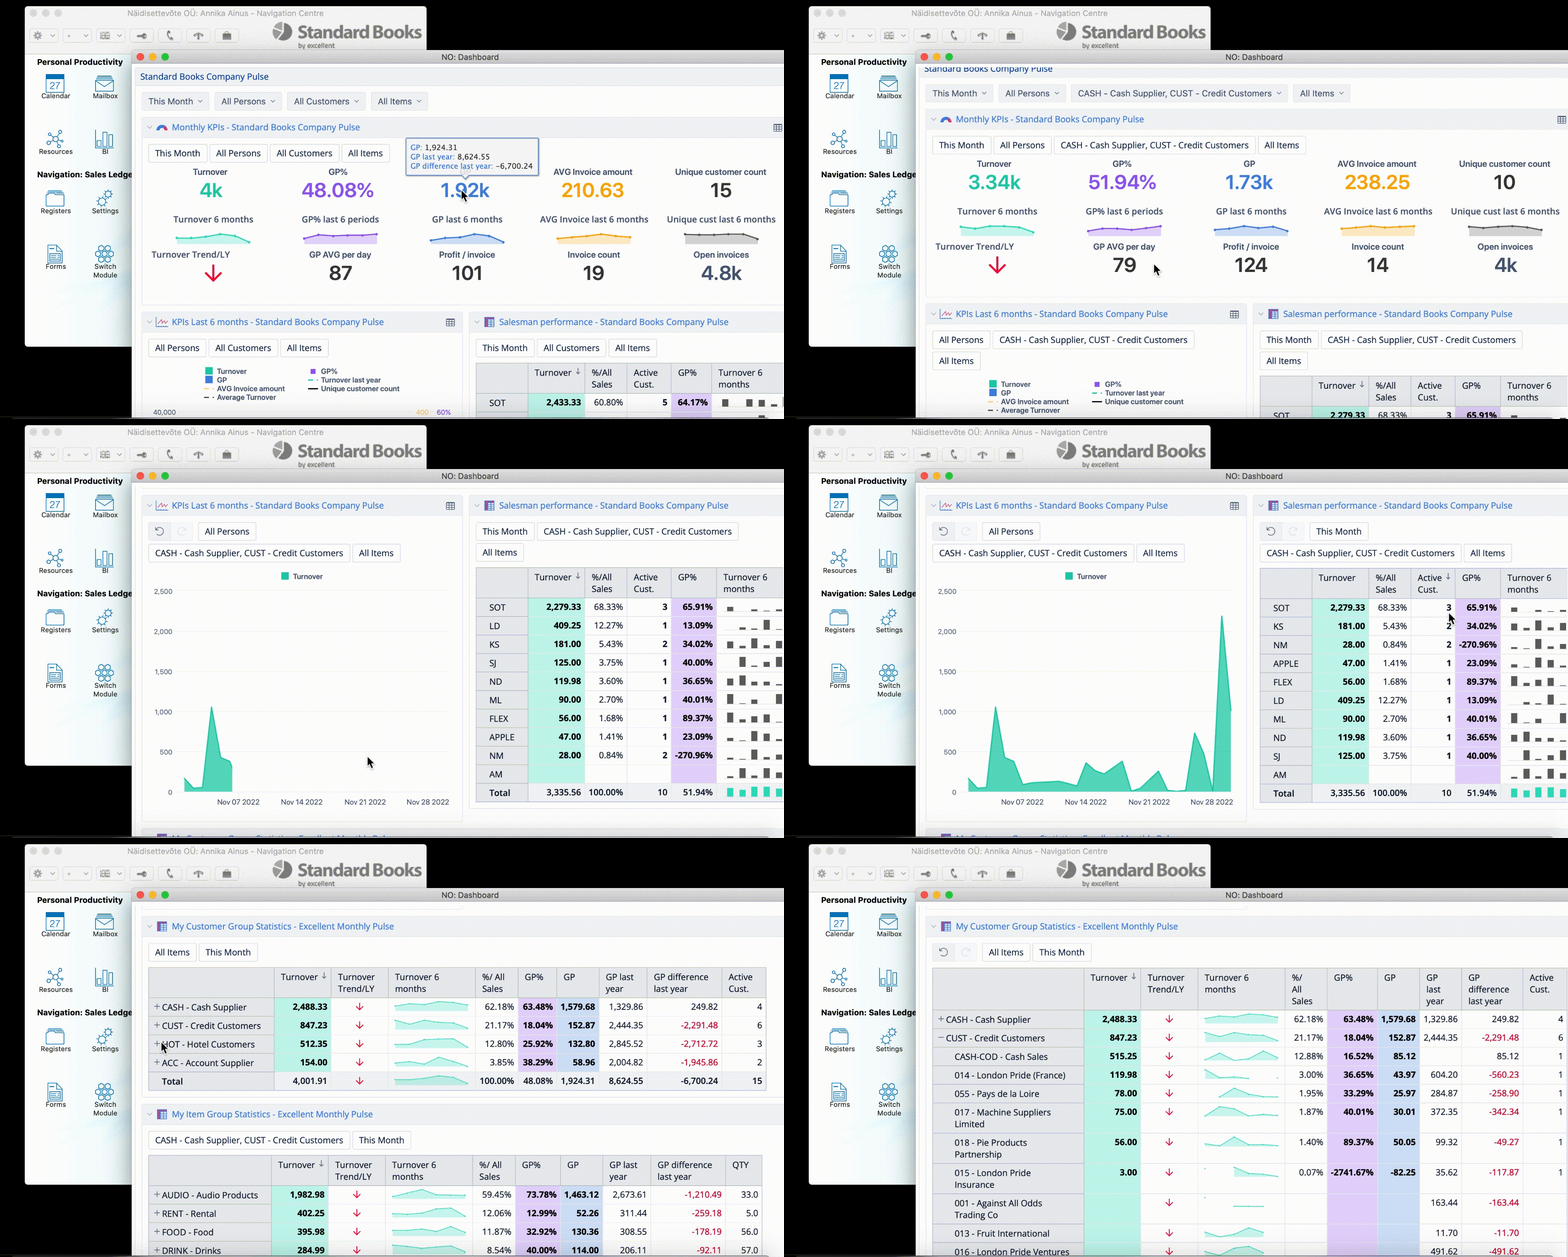
Measure and analyze your project and business KPIs. Identify trends, threats, and opportunities. Optimize and improve workflows, processes, and procedures.
Apply for 30 day trial
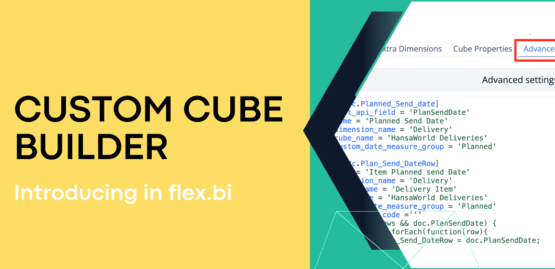
Our Standard Books source application now boasts enhanced flexibility with the addition of the custom cube builder. This feature allows users to encompass virtually any data, from production to hotel management, including modules, registers, and fields built with HAL. Create new cubes, dimensions, measures, and implement custom data transformations using JavaScript for unprecedented customization options.
Apply for 30 day trial
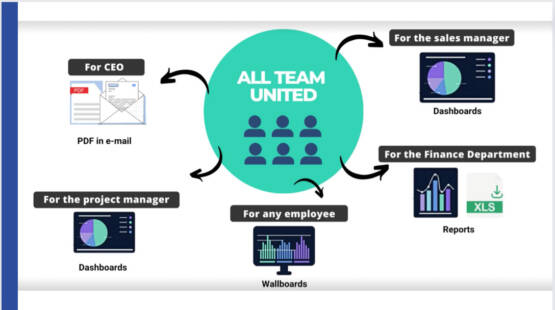
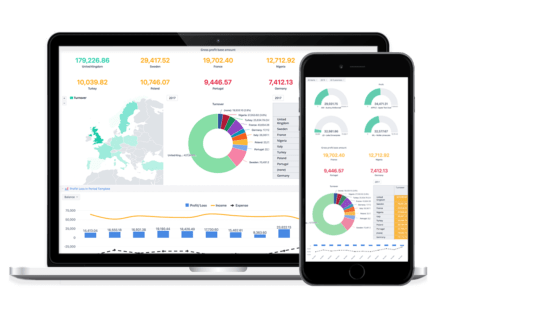
It is not only for managers, it is for everyone – dashboards in web browser, mobile device, Standard Books personal desktop, scheduled PDF in your email on Monday morning or Wallboard for sales team with relevant information for them. Communicate your company goals for all team members and make sure that use working towards the same common goal. Our data access roles will match even the most complex needs.
flex.bi is self-service reporting tool and we want to make it as easy for you as possible to get started. You can start with our templates for some inspiration and adjust the reports to your needs. You don’t have to be a programmer, just drag and drop report blocks, to find the answers you are looking for.
See Our Report LibraryPlease contact us for more details
You can visualize your budget plan and compare it with Live Standard Books data. Save time on manual data management. Personalized Profit and Loss reports and power of finance consolidation.
Work with your Contact lists, measure your customer satisfaction and plan actions based on results, NPS (Net Promoter Score). Calculate customer and employee efficiency.
See CRM dashboardFocus on project budgets and always be on top of your expenses. Motivate your team to focus on budget and plan future activities for each project.
See Project dashboardPredict future trends and sales results at the end of the month. Monitor performance of each agent and measure if they reach the targets.
See Sales dashboardDetailed item reports by location, routes and variations, as well as, classifications and objects. Stock turnover report will help you to see the progress.
See Stock dashboardMeasure performance of each shop and publish results on monitors to motivate your shop team. Communicate targets of your company in general.
See POS dashboardCombine sales orders data together with other module data to see the big picture of your customer activity and predict orders to your suppliers.
Request Sales orders demoAnalyze your pipeline and plan your sales based of quote statuses. Practise fact based thinking not guessing.
See Quotations dashboardBe the first one who knows about news and special offers