Flexible Business Intelligence
Every business deserves reliable control center to save time, make decisions faster and build effective teams.
Apply for 30 day trial
Customers from 15+ countries worldwide enjoy
flex.bi's powerful data insights.
Apply for 30 day trial
Customers from 15+ countries worldwide enjoy
flex.bi's powerful data insights.


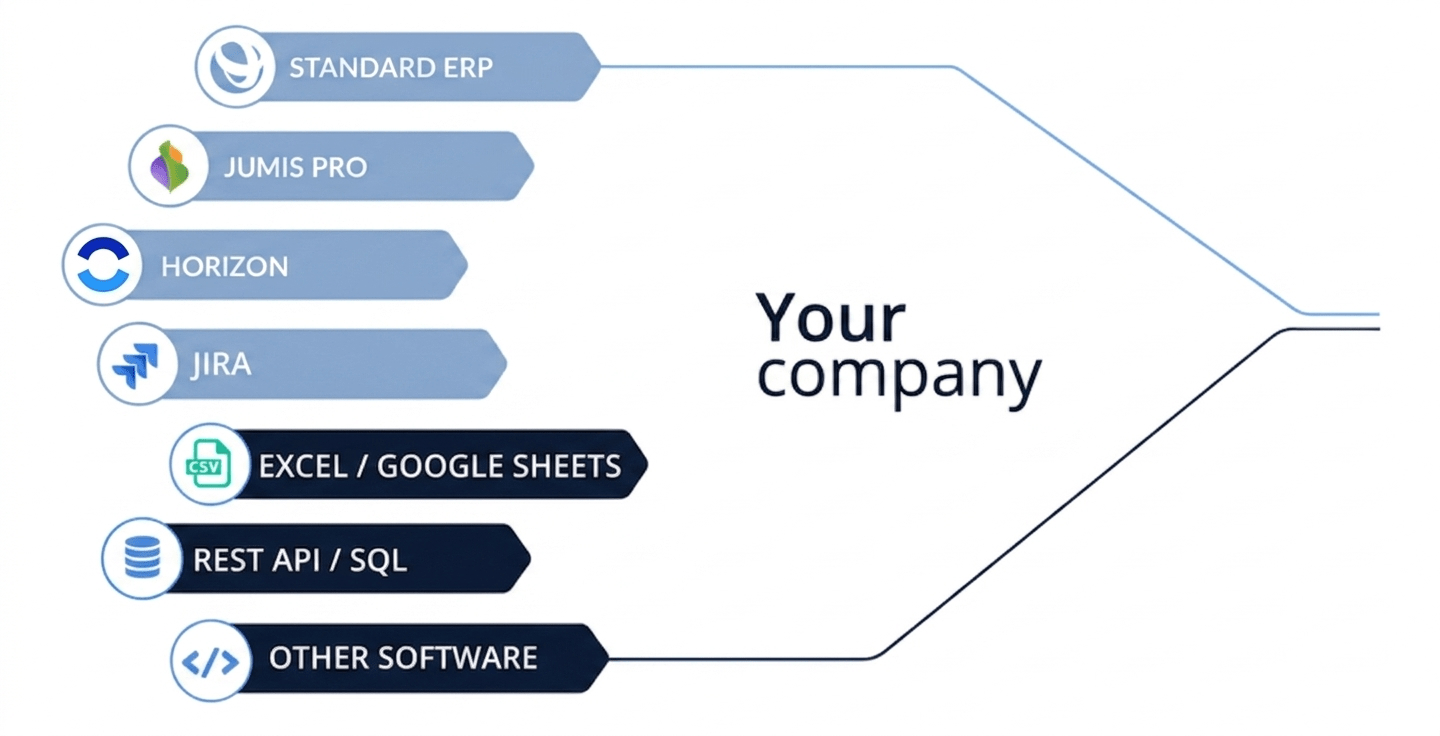
Get your first real time Business dashboard in 2 hours for all our standardised connectors.
Request for 30 day TRIALEasy to understand and access: JIRA, SERP, HORIZON, IOT, SQL and other REST API data sources are welcome!
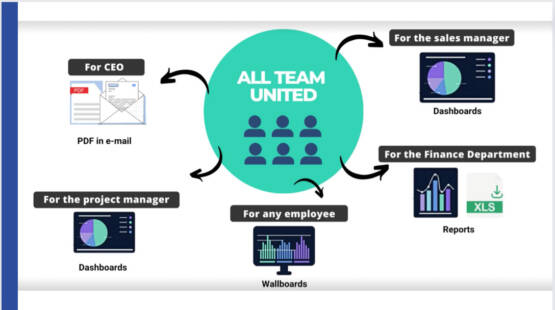
Read about IntegrationsWith flex.bi you can make all your team united – one vision, one goal! Embed dashboards on TV & email, alerts.
Get to know WallboardsCustomers report higher profits, more active teams and bigger revenue. flex.bi is is a "Game changer for business.
Tired of boring reports? Turn your business data into dazzling dashboards and instant insights – with zero hassle! Self service Business intelligence Dashboards that actually make sense (and look amazing). Automate reporting, analyze trends, Impress your boss and motivate your team.
Stop guessing. Start knowing.
Read More about Features
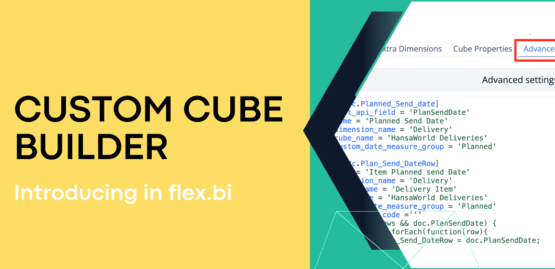
Yes, this is really happening – we have opened a whole new world for you! Have you ever wanted to build your own data cube structure, edit an existing one or share measures from different Business processes in one report? Now you can do it!Previously, if you wanted to do customizations mentioned above, you had to ask us to develop a custom cube and add it to your connector. Now it is all up to you.
Read More about the custom cube builder
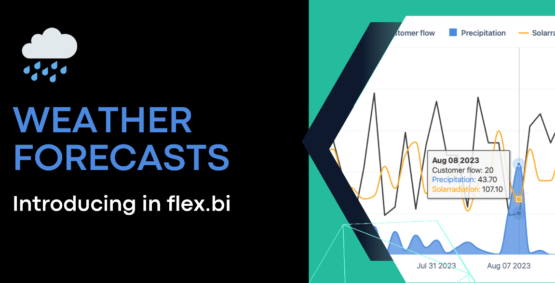
Enrich your data, by adding the weather context as measures or dimensions. You can import historical weather information and weather forecasts for up to 10 future days, to analyze your business results and goals in terms of temperature, precipitation, humidity and other weather factors.
Read More about Integration
The year 2023 comes with a new integration with Visma Horizon.
Trends and forecasting, customer segmentation, budget monitoring, sales team motivation, and efficiency analytics will simplify decision making processes across different industries.
Read More about Integration
With flex.bi you can :
WATCH flex.bi Demo video
Creating a culture of management by numbers is not an easy task. Numbers tell a story but how to get it right and deliver it to your team? Where to start, to end up with success? Before you begin, prepare yourself that this project requires good planning, passion, and a lot of patience. You can fix 99% of the technical things but lacking patience can be a project killer. So take a deep breath and jump in. It will be a journey where you will find out a lot about your business and values. Be ready for a couple of surprises too.
Read our article and start your journey
With the help from flex.bi the management is always keeping hand on the pulse about company’s direction and budget implementation. We have introduced united standard in all companies of the group and have saved a lot of time. Actual results are always available and help us make decisions promptly.

flex.bi is is the best BI tool to perfectly have your data from different Standard ERP modules and other systems in one view. The drill down functionality is wonderful.
flex.bi saves me hours of time in manually exporting reports into excel and creating reports and dashboards.
Drag and drop interface makes it easy to understand and create complex reports in minutes. The cube structure to data allows one quick access to large data sets.
Always willing to work together to solve a problem if it will further develop the system.
On-line interactive screens allows us to follow team results continuously and helps to accelerate decision making and implement improvements needed. It is perfect tool to motivate team to get better results and reach the targets.
Be the first one who knows about news and special offers