Save your precious time and find inspiration

Why should you invent a bicycle again?

See flex.bi in action and visit our template library

Our Report Library has hundreds of templates for every department. They are free of charge and super simple to import in your account.

Finance

Save time on manual data management. Profit and Loss reports, automated budget monitoring, simulations and powerful multi-company consolidation.

Visit Demo Dashboards
Executive

Plan your future and see the big picture of your business. Set industry KPIs and be faster than your competitors.

Visit Demo Dashboards
IT

Atlassian JIRA issue tracking software and GIT analytics will allow you to track your sprints, commits and monitor your task statuses.

Visit Demo Dashboards
Sales

Predict future trends and sales results at the end of the month. Monitor performance of each agent and measure if they reach the targets.

Visit Demo Dashboards
HR & Teambuilding

Why not to use simple way to influence your team and connect with it? Show them that you care and communicate your expectations to the team.

Visit Demo Dashboards
Operation and Logistics

Stock turnover calculation, logistic routes profitability, delivery peak hours and capabilities of your warehouse team. Calculate profitability per region or country. Customer segmentation and lead management.

Visit Demo Dashboards
Customer relations

Measure your customer satisfaction NPS (Net Promoter Score), calculate customer and employee efficiency, plan regular actions based on customer results.

Visit Demo Dashboards
Project management

Plan your projects' budget and measure team success. Monitor expenses and plan projects with Gantt chart.

Visit Demo Dashboards

Learn how to use templates

You can import a template in your account in couple of minutes

flex.bi is self-service reporting tool and we want to make it as easy for you as possible to get started. You don’t have to be a programmer. Only in couple of minutes you can create out-of-box reports that will display your own data and will be fully integrated in your environment. For more advanced examples you can visit Help & Support page and read a setup manual,  watch a video in our YouTube channel or give a shout to our support team who will guide you trough this process. Sounds doable right?


Visit our Youtube channel for more training videos
Online competitions*

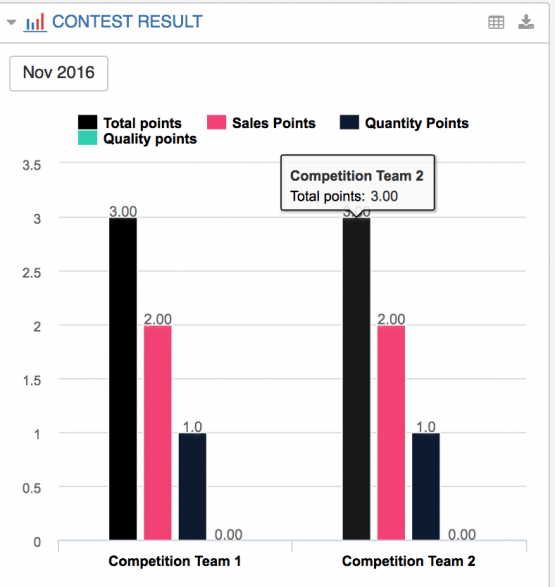
This solution allows you to create internal competitions based on results of your team. Why couldn’t you make reaching targets fun for everyone? You can set up the rules how teams can earn points – by sales quantities, quality, speed, activity, particular item sales or other values  you import from your HansaWorld and other systems. You can choose whether to focus more on team or on individual results. Quantity of members in the teams can be changed.

Read a setup guide

*Suggested to use together with Wallboard solution


Team competition dashboard
Target monitoring

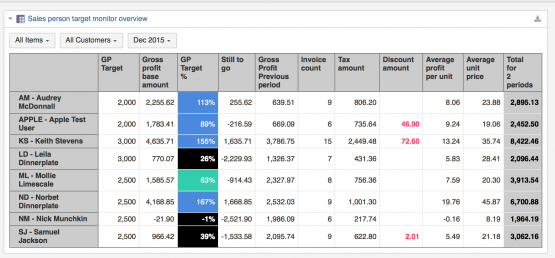
Setting targets help you and your team to realise the goals, see if you are moving in the right direction. There are 2 ways how to set target data in flex.bi –  inside the flex.bi interface or by using external file import with the necessary data. In our Templates we have shown how to setup salesperson’s targets but the same principle can be used if you want to monitor item group sales limits, customer group turnover or expenses by the object.

Read a setup guide

Target monitoring dashboard

Trends and Forecasts

Current period forecast

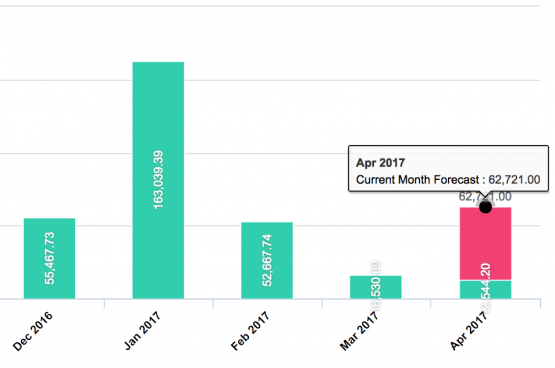
Sometimes we all wish we could see the future or at least a sneak a peak to what expects us quite soon. With flex.bi you can calculate possible prediction based on past period results of sales and budget implementation.
You can also play with projections of past periods data in future and add ” What if”  percent to the future results.

Read a setup guide

Forecasts dashboard

Start your free 30-day TRIAL! We will setup account on your data and provide training free of charge.

Get started now

Subscribe to newsletter

Be the first one who knows about news and special offers