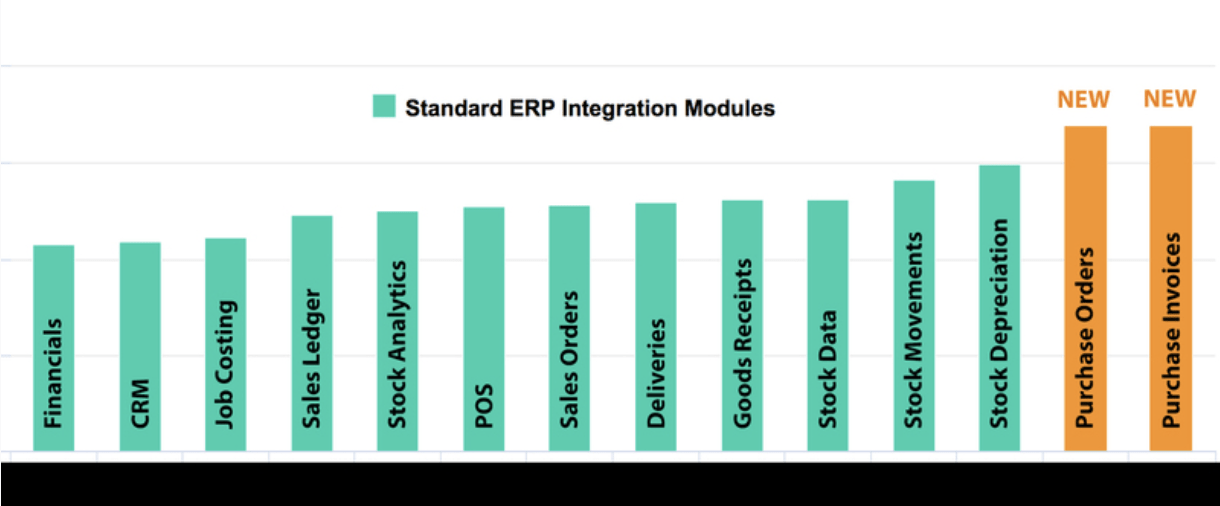
in 2015 flex.bi started with Standard ERP Sales Ledger analytics and proudly can say now that already 14 modules are in our portfolio. Thus giving you the opportunity to save time on manual data management! Most importantly, 2 new data cubes have been added to give you all the freedom to create reports about any topic that could be important for your business.
NEW data cubes
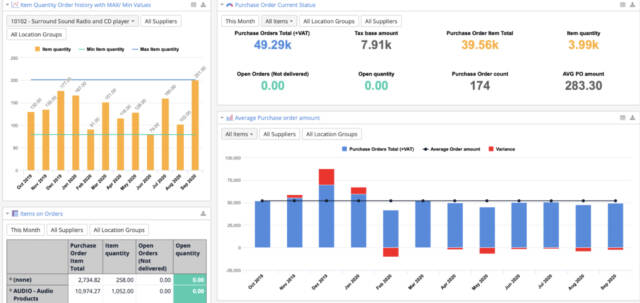
- Purchase Orders (click here to see Template) With this functionality you can see an overview of orders and Open amounts (not delivered yet). Our template will show you linear trends, Average Order values, so you could plan your future purchasing costs. You can analyze Purchase orders by Item and Item groups, Suppliers, Locations, Record status, Objects, Classifications, and many more fields. This Template dashboard is great to start your discovery, but custom reports of your choice can be created. Please contact support@flex.bi.
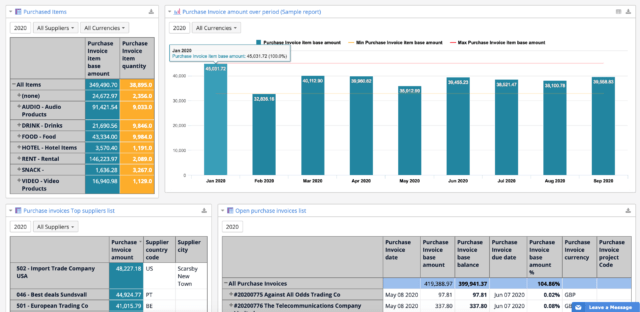
- Purchase Invoices (Click here to see Template dashboard) Control your costs (ensuring costs do not exceed your plans), monitor unusual purchasing trends. Get insight into which suppliers are the most advantageous to work with and what Items are ordered from each of the suppliers.
Good Old data cubes
- Financials (General ledger) You can visualize your budget plan and compare it with Live Standard ERP data. Save time on manual data management. Personalized Profit and Loss reports and power of finance consolidation.
- CRM (Customer relations) Work with your Contact lists, measure your customer satisfaction, and plan actions based on results, NPS (Net Promoter Score). Calculate customer and employee efficiency.
- Job costing (Project analytics) Focus on project budgets and always be on top of your expenses. Motivate your team to focus on budget and plan future activities for each project.
- Sales Ledger Predict future trends and sales results at the end of the month. Monitor the performance of each agent and measure if they reach the targets.
- Stock analytics Detailed item reports by location, routes, and variations, as well as, classifications and objects. The stock turnover report will help you to see the progress.
-
- Stock Data
- Stock Depreciation
- Stock Movements
- POS Measure the performance of each shop and publish results on monitors to motivate your shop team, therefore, communicate the targets of your company in general.
- Sales Orders Combine sales orders data together with other module data to see the big picture of your customer activity and predict orders to your suppliers.
- Quotations Analyze your pipeline and plan your sales based on quote statuses. Practice fact-based thinking not guessing.
- Deliveries Analyze your deliveries by location, delivery journal, save time on manual data management.