In this version, our focus has been on our core functionalities, which needed some facelift. We have reduced the clutter in Page selection lists so that you see only the things that you need. On top of that – page filtering is much faster and adjustable. SQL, Rest API, and File applications give you options to modify your raw data before importing it into flex.bi, using our standard calculations or a small JavaScript snippet. Read the full list and watch our Walk-trough webinar to see this all in action.
Nonempty Page Selection
Report Page dimensions have always been a convenient way to add a bit of flexibility to your reports, by creating one or more dynamic filters. These filters allow you to view the same data set from different perspectives, for example, by showing only the sales amounts in a particular store, made by a particular salesperson and maybe even only from a particular product group. In the previous versions this functionality had one drawback, though – when using multiple Page dimensions, each of the filter lists always showed all of the available options making the selection process harder than it should be. For instance, even after selecting a particular store, you would still have to find the right salesperson in a full list of sales department employees. And that’s a lot of names to choose from.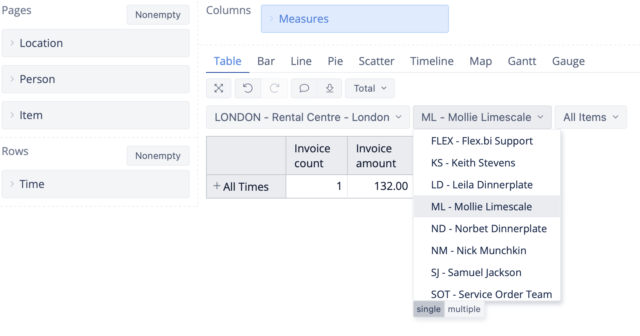
In this release, we have made your life easier, by adding a Nonempty option for Page dimension selection, that works a lot like the Nonempty option on the report Rows. If you select this option, each page dimension selection you make filters the selection lists of the subsequent page dimensions, showing only the relevant options. For example, if you select a particular store, the salesperson selection list will show only the employees that are related to that particular store. And after selecting a particular salesperson, the product group selection would show only those product groups that the particular employee has sold in the particular store. So no more clutter in the Page dimension selection lists.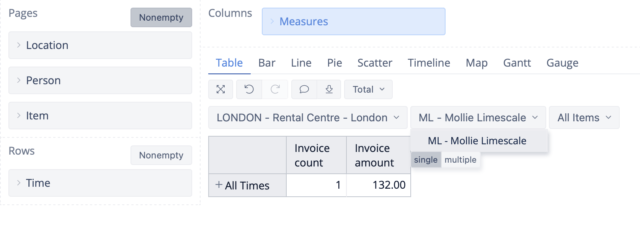
See more information on our documentation page here.
Editing of Common Dashboard Page Dimensions
Those of you, who are creating your own dashboards and using the Common dashboard page option, could have encountered a confusing situation when some options in a page dimension, made available in one of the reports, are not showing up in the dashboard common page dimension options list. Also, you could have experienced a bit of frustration, having to go over every report in a dashboard and add an additional page dimension selection option just to have this option available in the Common dashboard page dimension. Well, you can forget about those nuisances.
Now you can edit the Common dashboard page dimensions the same way that you would edit page dimensions in a report. This allows for much easier and flexible Dashboard common page dimension configuration. For example, if you have a dashboard with Time as a Common page dimension that allows selection of particular months, and you would like to add the Current Month option and make it the default for this dashboard, so that it always shows the current results, you can easily edit the page selection options and add the Current Month option. As easy as that.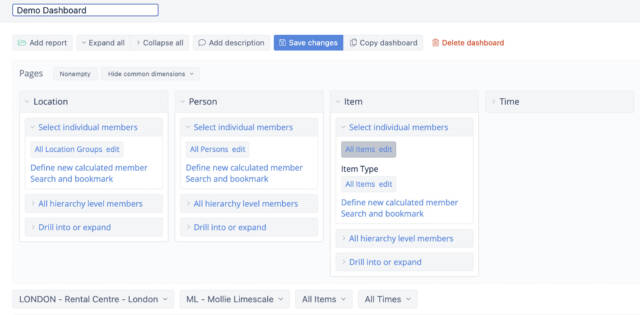
See more information on our documentation page here.
Improved Source Data Mapping for REST API, SQL, and Files Import
Rest API, SQL and File import applications are the most flexible data sources that we provide. They allow custom data mapping to create a unique BI data structure tailored to your particular needs. And now we have made these applications even more flexible by adding the following cool features.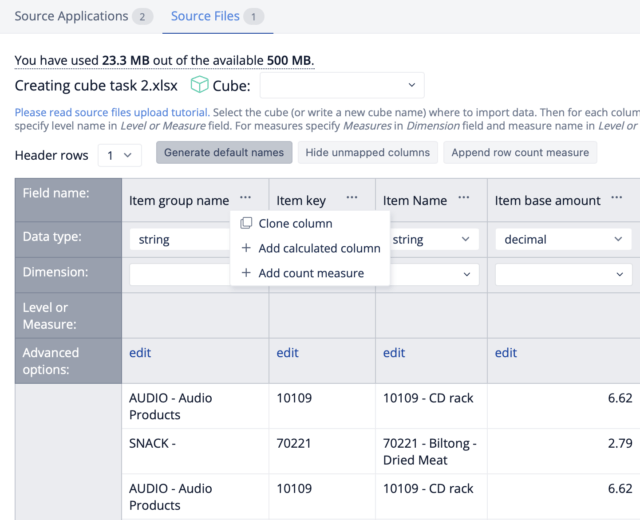
Clone Column feature allows you to duplicate a source data column in case if you would like to use the same source data for multiple purposes in your BI data structure. This could be useful for creating multiple measures from a single numeric source data column or creating multiple dimensions from a single string source data column.
Add Calculated Column feature allows you to create a new data column with pre-calculated values. Calculations have to be defined using JavaScript code snippets, so a bit of coding knowledge is required, but it is a small price to pay for the ability to adjust your source data before importing it into flex.bi. This opens a lot of new possibilities, for instance, creating a new column for a new dimension based on some existing source data values, or creating a pre-calculated measure values, so you don’t have to do it later using MDX.
Add Count Measure feature does exactly what the name suggests. It allows you to create a new measure for record counting by adding a new column populated with numeric values “1”. This is a small but very handy feature that can be used, for example, to calculate the count of sales transactions in a particular day, or deliveries made last month, or measurements taken this week. Whatever you are analyzing, now you can count it.
See more information on our documentation page here.
Improved Performance of Report Execution
Last but not least are some under the hood improvements that allow much faster report execution. The main focus of these improvements have been the following.
Standard calculations like Statistical, Linear Trend, Cumulative Sum etc. – now these calculations run a lot faster eliminating the lag time when working with a large data set.
Multiple selections in page filters – in the past, we have discouraged making multiple selections in page dimensions because it caused a lot of load on the system and resulted in long load times. Now, this is no longer an issue. For example, if you want to show data about multiple days, you can select those dates in the Time dimension page selection using the multiple option without making your report a lot slower.
Drill through cell option has also been boosted with some speed, so go ahead and drill into some details of your reports.
These are just our top picks from all of the new features in flex.bi 6.5.0. Please, visit our changelog, for the complete list, and of course, explore and check out those goodies yourself in your account.
Keep warm and keep on reporting!