Standard ERP Account Groups for Financial Reports
When you re-create Profit and Loss or Balance Sheet reports in flex.bi Financials, you want to see accounts organized in groups, the same like they are in your Standard ERP. Now, these groups will be synchronized by selecting the “Import account groups from HansaWorld User defined reports” checkbox, located in Cube properties section. When enabled, this feature automatically creates the required account groups in the Financials cube of your flex.bi account.

With this function you can set up well-known reports from SERP much faster and most important – 100% precise, providing a common point of reference in both systems, in just a few clicks. Just import the data into Financials cube, select the automatically generated account groups and check if the results match your SERP reports.
See more information on our documentation page here.
Analyze data from Visma Horizon ERP – New flex.bi Integration
We are always looking for new horizons, and with this release, we are offering a new integration with Visma Horizon ERP. The first data cube is Financials, which allows you to analyze Financial transactions, calculate balances and find the money frozen in debit.
Easy and automated financial data reporting for Visma Horizon customers in flex.bi.
- Create most common financial reports: Profit & Loss, Balance Sheets, and others
- Automate Budgets control for Visma Horizon Customers
- Analyze your Visma Horizon data together with other valuable business information added it from Google Sheets or Time2Submit application.
This new flex.bi Source application comes packed with our powerful custom fields functionality, which allows per customer customizations without the time and cost-consuming programming. So if the standard Financials cube is not enough for you, it can be customized to your needs.
See more information on our documentation page here.
Conditional Formatting for Charts
In this version, we have taken the Conditional Formatting feature to the next level. Previously value-based formatting was available only in tables, but now you can use colour coding also in Bar, Line, and Timeline charts.
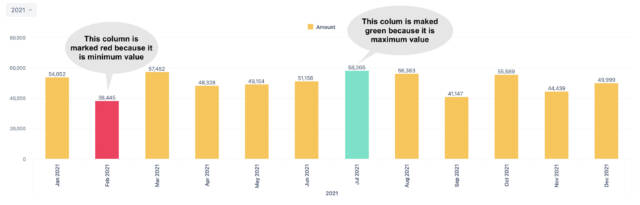
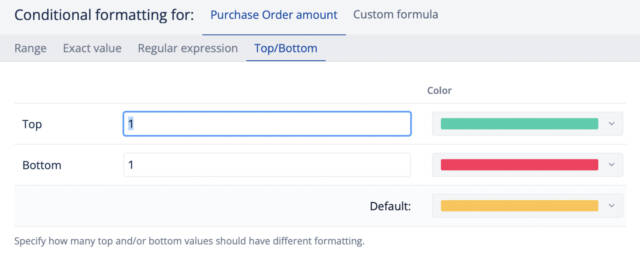
For instance, you can highlight the max and min values or use a different color to mark the values that exceed a critical limit.
This new feature adds a new condition-based information layer to your reports, making them more dynamic, readable at a glance, and of-course more flexible.
See more information on our documentation page here.
Custom Fields for Jumis PRO Application
Jumis PRO integration has been here for a while, but in this release, it has been rebuilt from the ground up. Even though it could look the same – Financials cube with Account, Partner, and Budget Item dimensions, but under the hood, we have added custom fields support for those that need that extra mile.
Using the custom fields functionality, you can add new measures for import, create new dimensions or create custom hierarchies, by adding custom code to the TOML interface. If you don’t feel confident about implementing these changes yourself, don’t worry – we will help you with that, and together we will build the right data structure for you.
See more information on our documentation page here.
These are just our top picks from all of the new features in flex.bi 6.4. Please, visit our changelog, for the complete list, and of course, explore and check out those goodies yourself in your account.
Keep safe and keep on reporting!