This flex.bi version is all about data visualization improvements. The good-old table has become much more attractive and colorful, thanks to the introduction of Sparklines and enhanced cell formatting options. Also, the dashboards are now more flexible, allowing you to manually resize each report.
Sparklines
Remember the times when you looked at the report’s table view and saw only numbers on top of numbers seasoned with, guess what, some more numbers? Well, that’s all in the past now.
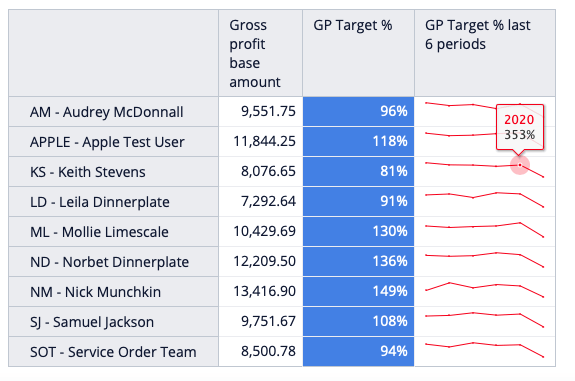
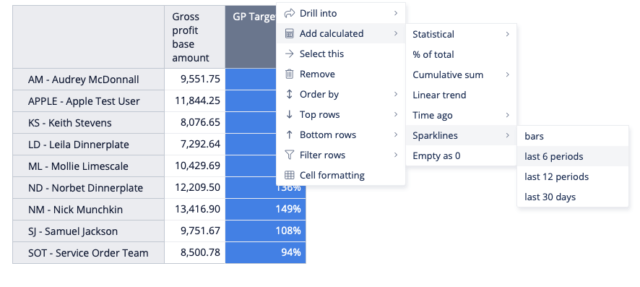
Thanks to our new feature Sparklines, you can lighten up the mood of your serious table with a bit of visualization, plugging small, colorful graphs right in the cells, to show trends, proportion or progress at a glance. You can choose the color and also the format of your Sparkline, to display line, area, bar, or column graph. Depending on your skills and report complexity, you can add Sparklines with just a few clicks or throw in a line or two of MDX for more custom solution.
Cell Formatting
In the previous versions, you had only one option for conditional cell formatting, using a value range. While it was quite useful for brightening up the place and making the table more readable, something was missing. This feature was missing flexibility and we just couldn’t have that. But not anymore!
Now you can customize cell formatting and throw in some color and style based on:
- Value range, like you did before,
- Exact value,
- Regular expressions that are extremely useful for text field formatting,
- Top/Bottom values for highlighting few of the highest and lowest numbers,
- Relative comparison of the values, to crate real Heatmaps.
All of these options are available out-of-the-box with just a click of a button, but if this is not enough, feel free to roll up your sleeves and create your own conditions, using the custom formula option.
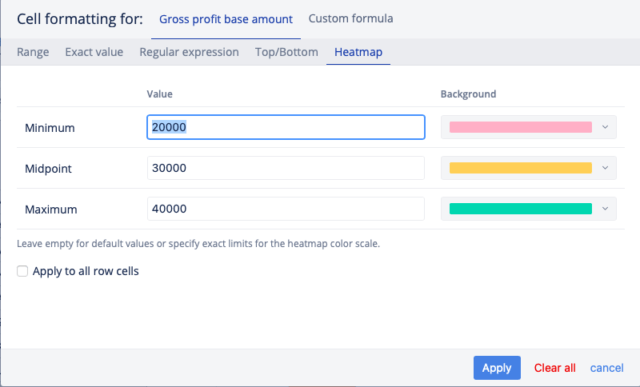
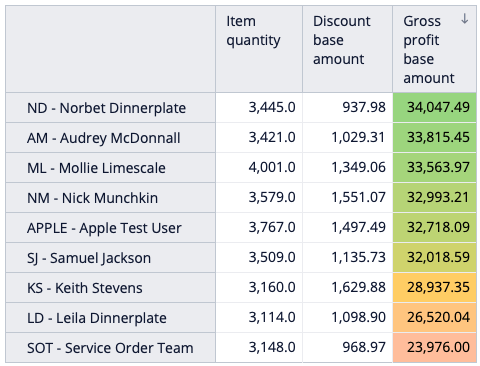
Heatmaps Made Easy
You could create Heatmaps also in the previous versions, but back then it required some work – you had to define a precise value range for each color, so it took some time to get a nice and gradual Heatmap. Now all you have to do is select minimum, midpoint and maximum values and colors and flex.bi does the rest.
Dashboard Layout
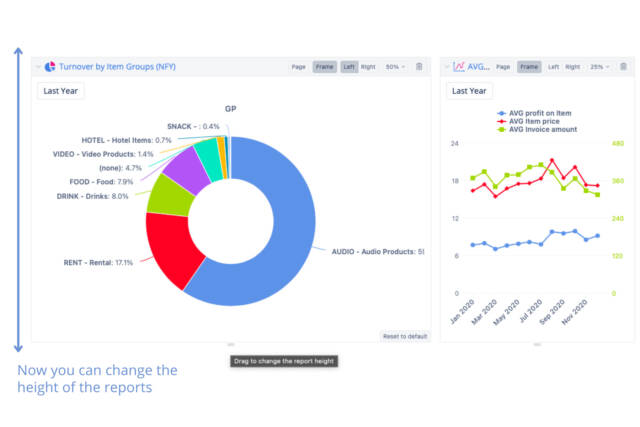
Dashboard is what it’s all about. Anyone who has ever tried to make a perfect looking dashboard, knows the struggle of aligning reports so that their height matches and you don’t end up with empty spaces between the borders.
With this version, we are introducing a small but nifty feature – a tab below the report, that you can easily drag to change report height with a precision of a pixel. This allows for a perfect layout in your dashboards so that everything and everyone is on the same level.
These are just our top picks from all of the new features in flex.bi 6.3.0. Please, visit our changelog, for the complete list, and of course, explore and check out those goodies yourself in your account.
Keep safe and keep on reporting!