In this release, our main focus is on user experience improvements, that may seem small at the first glance, but will make your life and reporting much easier and satisfying during everyday use. There are some tweaks for calculated measures, a new custom hierarchy function and an improvement for import error handling for HansaWorld customers, and a couple of other features that will improve your quality of life.
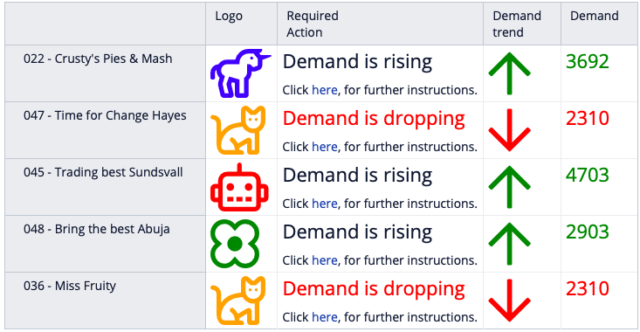
Add Symbols & Colours For Tables With Markdown
When creating table reports, it is essential to make them pleasing to the eye and easily understandable in a glance. This can be achieved by using different colors and styles for your data, by changing row and column formatting.
Now, in addition to the standard formatting, you can give a unique touch to each measure, using the Markdown formatting feature. You can make the output text bold, pink, a link, or even put a unicorn in there for those extra special results.
Less Hassle from ‘Unauthorized’ Errors
Those that have been importing data from HansaWorld server via Rest API connection are used to the occasional e-mail from flex.bi regarding the ‘Unauthorized’ error and necessity to go to the account and authorize again. This inconvenience, generally caused by short-term connectivity issues or HansaWorld server maintenance works was one of the top topics in our support channel. So, by the popular demand, we have finally made it better.

Now, if the HansaWorld server can’t be reached, flex.bi will try to reconnect for a couple of times, before raising the annoying ‘Unauthorized’ error and asking for the user to step in.
Though this is a fairly technical under the hood improvement, we feel that it could be the main improvement of users’ quality of life in this release.
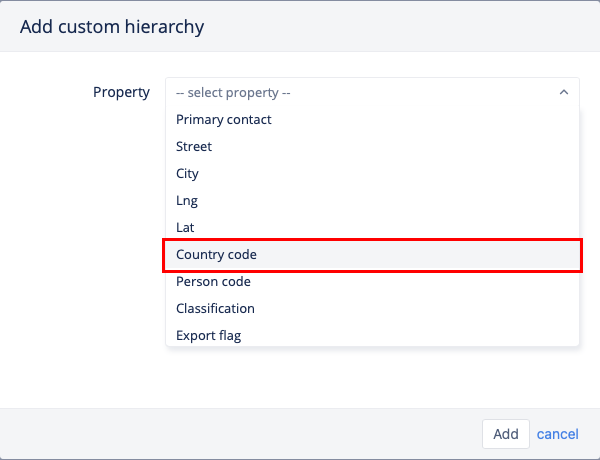
Custom Hierarchies from Property Values
When building reports, dimensions are the primary tool that you use for data aggregation and filtration. You may have noticed, that in some of the dimensions there are multiple hierarchies that give you an extra flexibility to choose the way you want to see your data.
With this release, we are going one step further. Now, in HansaWorld data cubes, you have an option to create your own custom hierarchies using a property of the particular dimension. For example, it takes just 2 clicks, to aggregate your clients by country.
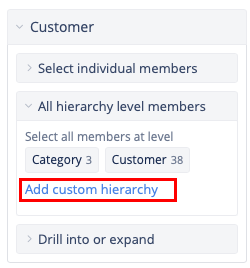
And you can take this even one step further, by combining this feature with custom property import from a file. The possibilities are quite awesome.
At the moment, the feature is available in Customer, Person, Item, Account, and Supplier dimensions.
New Tricks for the Old Calculated Measures
Calculated measures are the backbone of every customized report, and working on those measures can make up the bulk of the time you spend on building your reports. For this reason, we want to give you more control over these measures and provide more information about them.
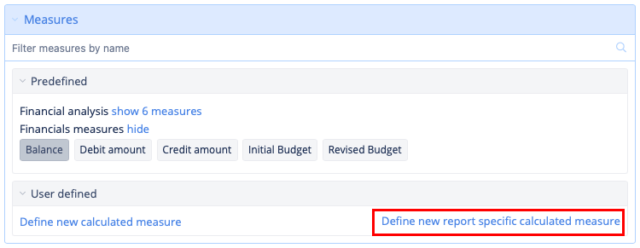
Report Specific Calculated Measures
If you have a lot of reports in your flex.bi account and in those reports you have defined a lot of calculated measures, then you know that they tend to pile up and at some point, you are left with a huge list of calculated measures that can create a clutter in your flex.bi account.
To reduce this clutter, now you can define report specific calculated measures, that are available only in the report that they are created in. This feature can help you in keeping your work environment nice and tidy.
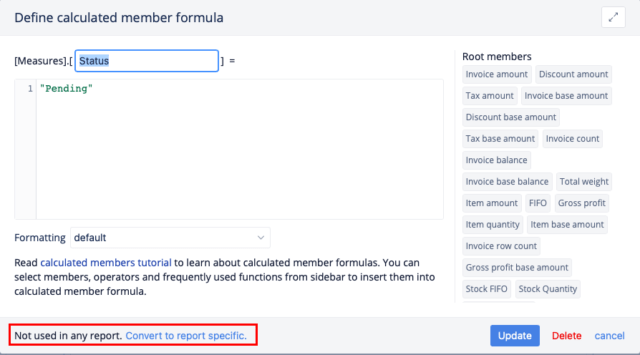
Information About Calculated Measure Usage
In the course of building new reports or adjusting the existing ones, you may have to change previously defined calculated measures. This can raise dependency issues, because those measures an be used in different reports and other calculated measures, and changing one thing can lead to unexpected changes somewhere else.
To prevent unintended and unnoticed changes, now you can see the information about the usage of a particular calculated measure in reports and other calculated measures so that you can make an informed decision about the changes and understand the extended effect of those changes.
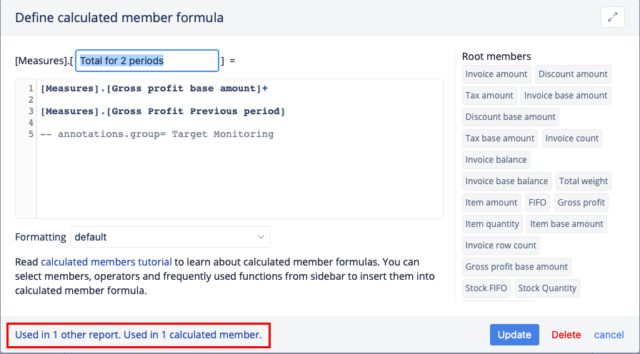
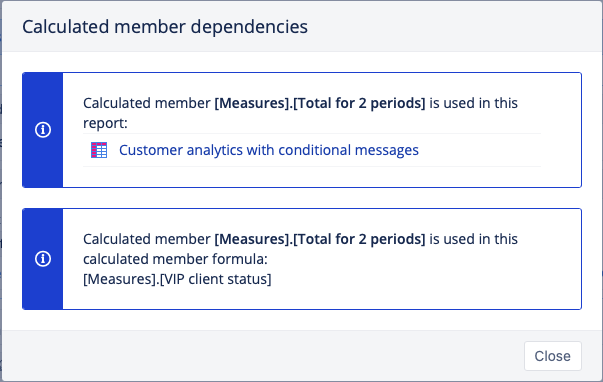
This is also useful for account cleanup. If a calculated measure is not used, then it is not useful and can be deleted, on the other hand, if a calculated measure is used only in the current report, then you can convert it to a report-specific calculated measure.
Reminder of Unsaved Changes
We all have been there, working on a report for hours and then accidentally navigating away from the report page, without saving the changes. Oh, the misery and sorrow! But no more!
Now, when you try to leave before saving your work, you will get a friendly reminder, so that nothing is lost on the way.

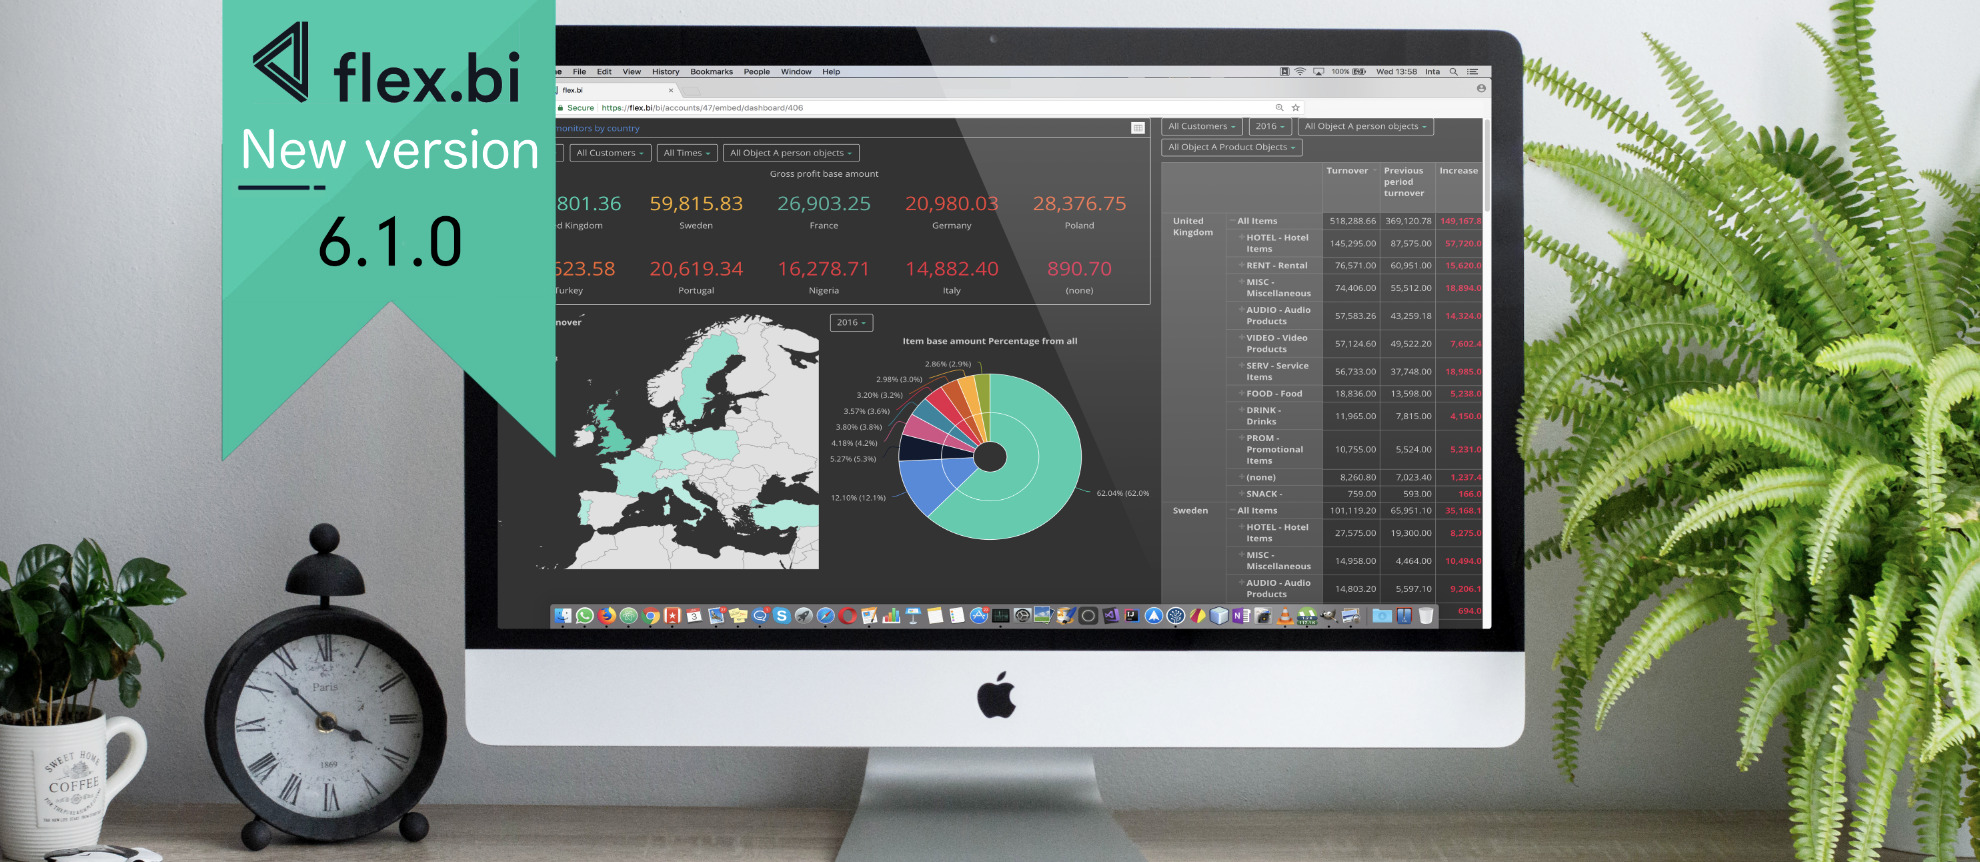
These are just our top picks from the abundance of new and exciting features in flex.bi 6.1.0. Please, visit our changelog, for the complete list, and of-course explore and check-out those goodies yourself in your account.
Keep safe and keep on reporting!