Flex.bi 5.1.0 is here and we think it’s awesome – based on modern architecture and packed with cool and handy features that will make your reporting much easier and more fun. In this blog post, we will highlight just some of our favorites.
Stop Looking, Start Finding – Measures Filter
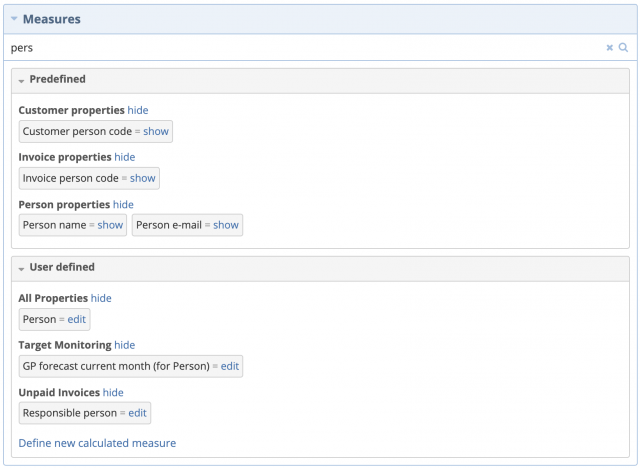
In the past, you had to look for your measures in different groups and sub-groups, expanding often clattered sections and going over loads of names, just to find the one that you actually needed. Guess what, the time of “finding Waldo” is over. Now, all you have to do is click on the filter field and start typing the name of the measure, and flex.bi will find and show you the matching measures from the entire cube, that you can select from. No more eye strain for you!
Customize Measures Like a Pro – Standard Calculated Members
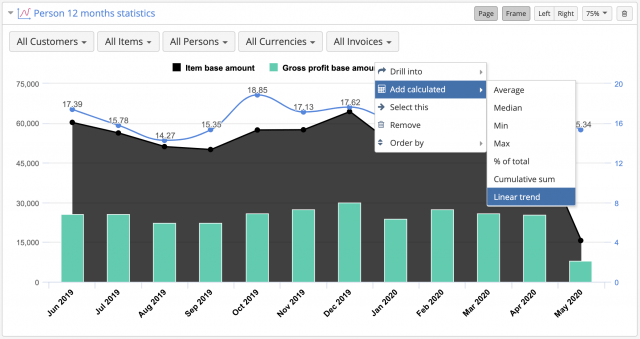
For those of you who need that extra mile over the pre-defined measures, we have introduced a handy shortcut for creating your own custom metrics on top of the existing ones. For example, you can add a calculation of linear trend of your average income, with just a couple of clicks and without writing a single line of code. Just select the existing measure, you wish to use in the calculation, click on the Add calculated option and select one of the standard calculated measures, e.g, Average, Median, Min, Max, % of the total, Cumulative sum and Linear trend. Is this not enough flexibility for you? No problem! You can copy the formula of any standard calculated measure and fine-tune it to your needs like a pro.
Remove Unwanted Dimensions With Ease
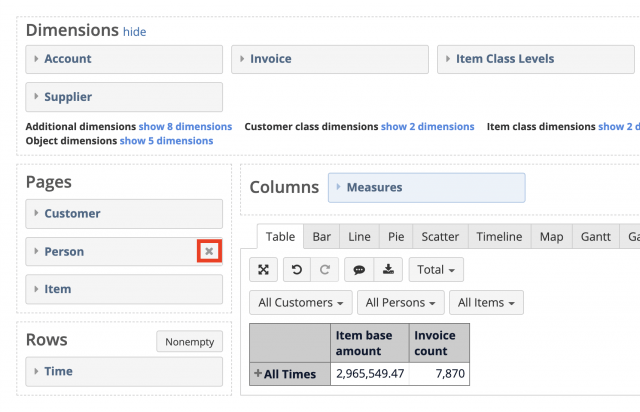
This is a small but quite nifty upgrade. You no longer need to drag unwanted dimensions out of your reports just to drop them back on the dimension selection area – now you can just “ex” them and forget about it, as certain Friend would say.
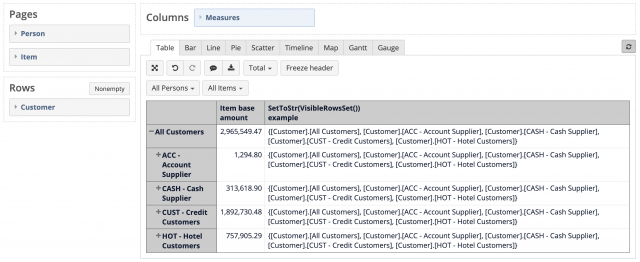
Calculations Only On Visible Rows
Sometimes, working with data can get confusing, because even hidden information can be used in calculations and aggregations, creating kind of an “iceberg situation” when you have no idea what’s underwater. To avoid this navigation hazard, we have created a new MDX function that makes sure that you see the whole picture. Using the VisibleRowSet function, you can be sure that you are working only with the data visible in your report and there are no hidden surprises.
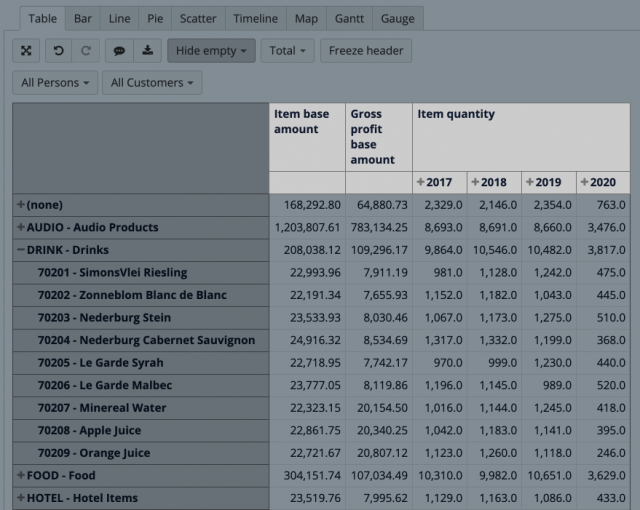
Drill With Craftsmen’s Precision
If you are working with large reports containing many measures side by side, it can be tricky to choose a single level of detail for all of them, and now you don’t have to. In this version, we are introducing a more precise drill-down feature that lets you drill into a particular measure, leaving the rest of the report as it is. So go on and drill deep, without shaking the ground around you.
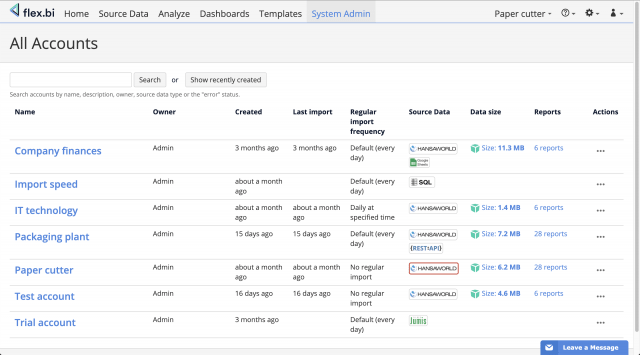
Account Overview – A Cherry For the Admin
And to top this with a “cherry”, we have enhanced the account administration page, giving your admin the powers that he/she long deserved. Here admins can see all of your accounts, including information about account size, report and dashboard count and owner information, last data import dates, import sources, and errors. Basically, the stuff that they need to know, so you don’t have to worry about it.
New version 5.1.0 Walk-through Webinar
In this short walk-through webinar, we will tell you more about the new functionalities and how they will optimize your workflow.
These are just our top picks from the abundance of new and exciting features in flex.bi 5.1.0. Please, visit our changelog, for the complete list, and of-course explore and check-out those goodies yourself in your account.
Keep safe and keep on reporting!