Maps help you organize information and figure out where you are and where you want to go. A map isn’t just a picture, it inspires you to think outside your world, to expand your horizons, and explore the places you have been and the places you want to go to. Maps are the perfect conversation starter. Do we have to continue?
flex.bi Map charts
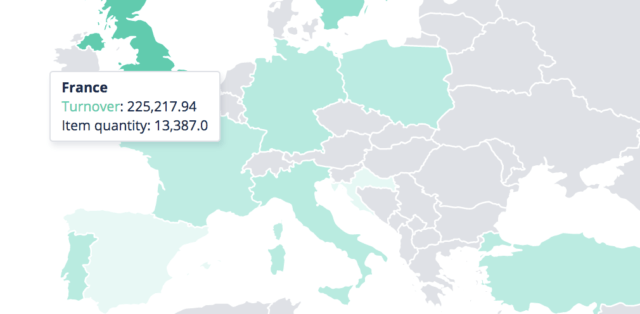
f you want to have a visual representation of your data in the context of a world map, you can create Map chart using any field that contains country code. Map chart is easy to navigate and interactive. It provides a way to compare data between countries and regions, allowing to analyze differences and notice trends or patterns. Learn more here
You can use Map Charts for:
- Visualizing your market shares;
- Strategic business planning;
- Segmenting your customers.
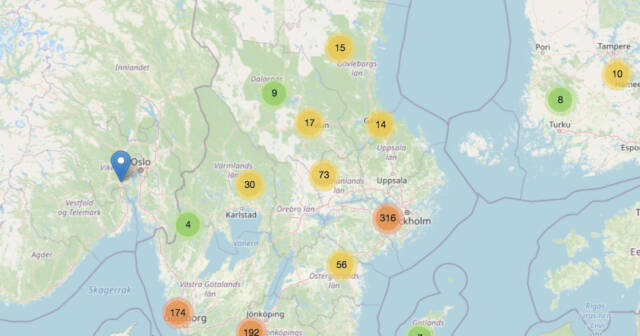
flex.bi Geocoding engine
If you have address information in your data set, flex.bi can provide a precise and beautiful display of this data on a map. The Geocoding feature is used to convert customer and supplier address data into precise geographical coordinates that can later be used for data visualization on a Map chart. Learn more here
You can use Geocoding for:
- Client coordinate analysis;
- Analyzing your manufacturers and producers;
- Logistics analytics;
- Analyzing retail locations.
Geocoding functionality is available for flex.bi Cloud and Enterprise users. Please note that usage of Geocoding functionality is subject to extra costs that are proportional to the amount of location data.
Have any questions? Let us know: support@flex.bi