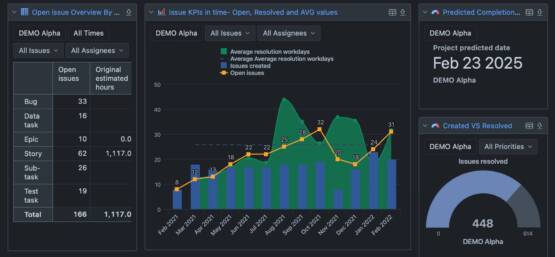
*flex.bi is built on eazyBI platform basis and ensures Jira as one of the data sources. We have more than 10 years experience in Jira data analytics and qualification of eazyBI experts & training partner. We can help you to setup, customize and deliver consulting for more complex projects where Jira data is Involved. Of course - you can add your ERP or other data on top of that.
Apply for 30 day trial
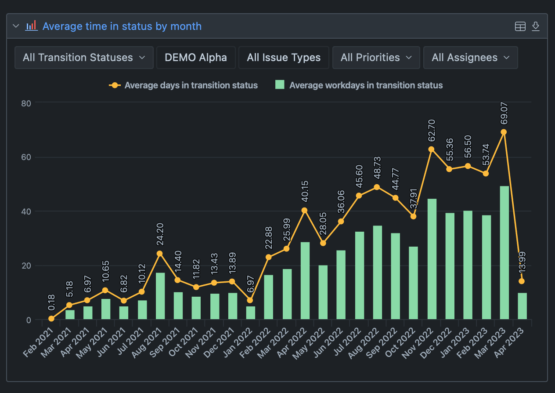
You can analyze your project results, process, calculate Average issue resolution speed , and add Jira Custom fields too. With Jira application you can track any progress of development, analyze employee performance or implement any other scenario you use Jira for. We can implement dashboards that monitor KPIs for specific methodologies, like Agile, Kansan, Scrum, LEAN etc.
Apply for 30 day trial
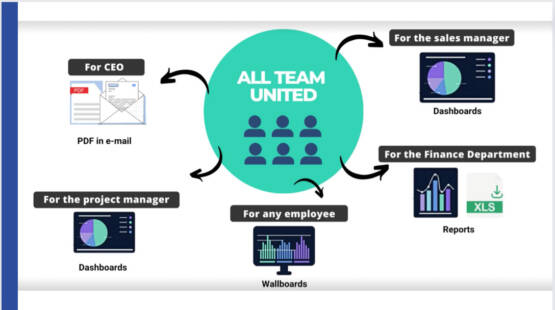
It is not only for managers, it is for everyone – dashboards in web browser, mobile device, scheduled PDF in your email on Monday morning or Wallboard for sales team with relevant information for them. Communicate your company goals for all team members and make sure that use working towards the same common goal. Our data access roles will match even the most complex needs.
flex.bi is self-service reporting tool and we want to make it as easy for you as possible to get started. You can start with our templates for some inspiration and adjust the reports to your needs. You don’t have to be a programmer, just drag and drop report blocks, to find the answers you are looking for.
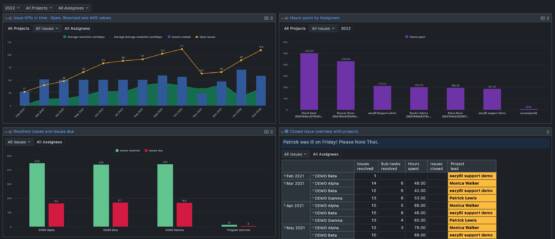
See Our Templates for Jira dataAverage resolution working days, Hours logged, Issues resolved by type and Project type. Create Strategic & Operational dashboards for Jira data.
See Issue analytics DashboardFocus on project budgets and see progress. Motivate your team and share results with them. Plan future activities and predict project finish date. Add extra values from Google Sheets or XLS files.
See Project analytics dashboardEvery method has their KPIs, we can help you to implement monitoring in flex.bi and eazyBI dashboards. Current backlog, Average throughput, Work in Progress.
Se example of Kanban MetricsShare results with Your Team on TV screen and encourage them to be more active. With built in Wallboards function it is easy now.
See Wallboard in ActionBe the first one who knows about news and special offers