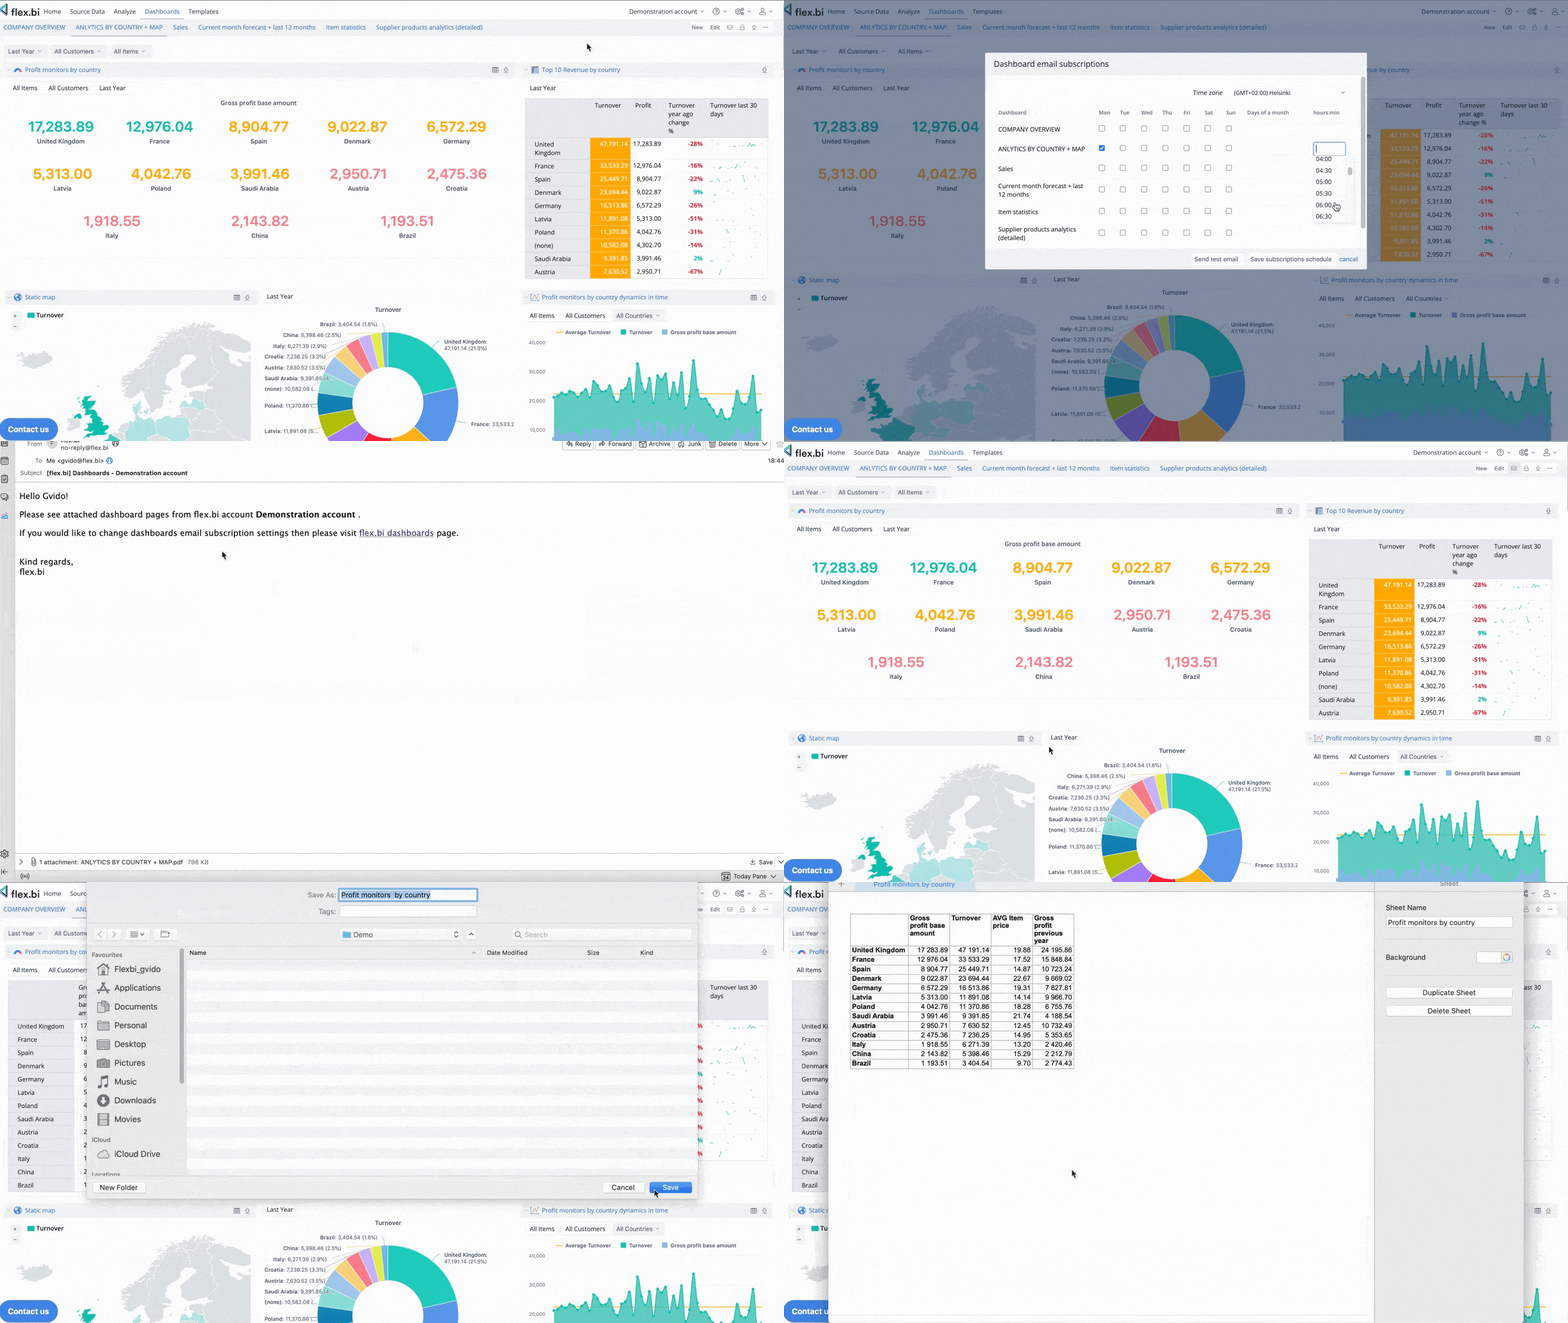
Explore and analyze your data with an instant feedback. Start with a summary and dig into details to examine your business data with multi-dimensional analysis. Drill-in or across other dimensions right from the report. Find actionable insights, trends, and opportunities, make smart and data-driven decisions.
WATCH DEMO VIDEO
Even when your reports are built and published, they are not set in stone. They can be easily adjusted with a couple of clicks and drag-and-drops.
Find Your answers in our Support Center
Create custom reports, charts, and dashboards with an easy-to-use drag-and-drop report builder. Create new tables, charts, reports, and dashboards with just a couple of clicks. Quickly discover new insights and opportunities with all your data at your fingertips.
See our Video Series "Fist steps In flex.bi"
Go way beyond basic analysis by creating new measures and powerful calculations. Start with many predefined calculations or write your own using the built-in MDX editor with auto-complete and syntax highlighting. Perform multi-dimensional analysis and examine your business data in almost any way you need.
From beginner to expert - flex.bi Academy Training programs
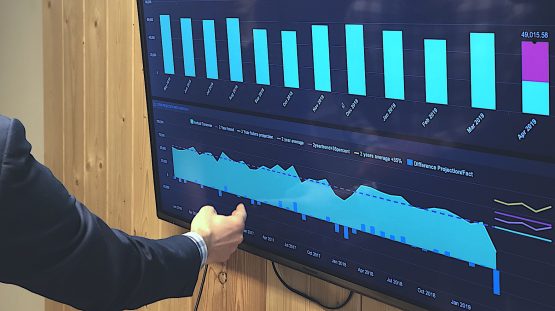
Not. all users want & can to log in into BI , no worries we have solution for them. You can setup a Wallboard on TV screen for your SalesTeam, Warehouse operatives or Delivery guys, to keep them informed about current statuses and progress.
Read more about Wallboard possibilities
Be the first one who knows about news and special offers